
South Africa’s 30-Year Spending Report Card: Trillions Deployed – Disappointing Returns
Over the past three decades, post-apartheid South Africa has spent vast sums of public tax money on infrastructure, education, healthcare, small business development, and policing. Successive governments have justified high levels of taxation and borrowing with promises of inclusive growth, job creation, and service delivery. Yet the outcomes tell a sobering story of capital misallocation,
South Africa’s 30-Year Spending Report Card: Trillions Deployed – Disappointing Returns
Over the past three decades, post-apartheid South Africa has spent vast sums of public tax money on infrastructure, education, healthcare, small business development, and policing. Successive governments have justified high levels of taxation and borrowing with promises of inclusive growth, job creation, and service delivery. Yet the outcomes tell a sobering story of capital misallocation, weak execution, and diminishing returns.
The Scale of Spending (1996–2026)
South Africa’s consolidated government expenditure has grown dramatically. From roughly R200 billion in the late 1990s, the budget has ballooned to over R2.1 trillion by 2025/26.
Key areas received substantial allocations:
- Education: Consistently the largest line item, averaging 6–7% of GDP. Cumulative spending over 30 years exceeds R10 trillion (inflation-adjusted estimates).
- Healthcare: Around 4–5.5% of GDP annually, with massive additional investment in the HIV/AIDS response (ARV programme).
- Infrastructure: Public-sector infrastructure spending totalled hundreds of billions annually in the 2000s and 2010s, including major projects like Gautrain, Medupi, Kusile, and road upgrades.
- Small Business Development & DTI: Billions channelled through the Department of Trade, Industry and Competition (dtic), DSBD, SEFA, and various incentives.
- Policing & Crime Prevention: Significant increases in SAPS budget, though often criticised for poor value.
Graph 1: Government Debt-to-GDP Ratio (1996–2026)
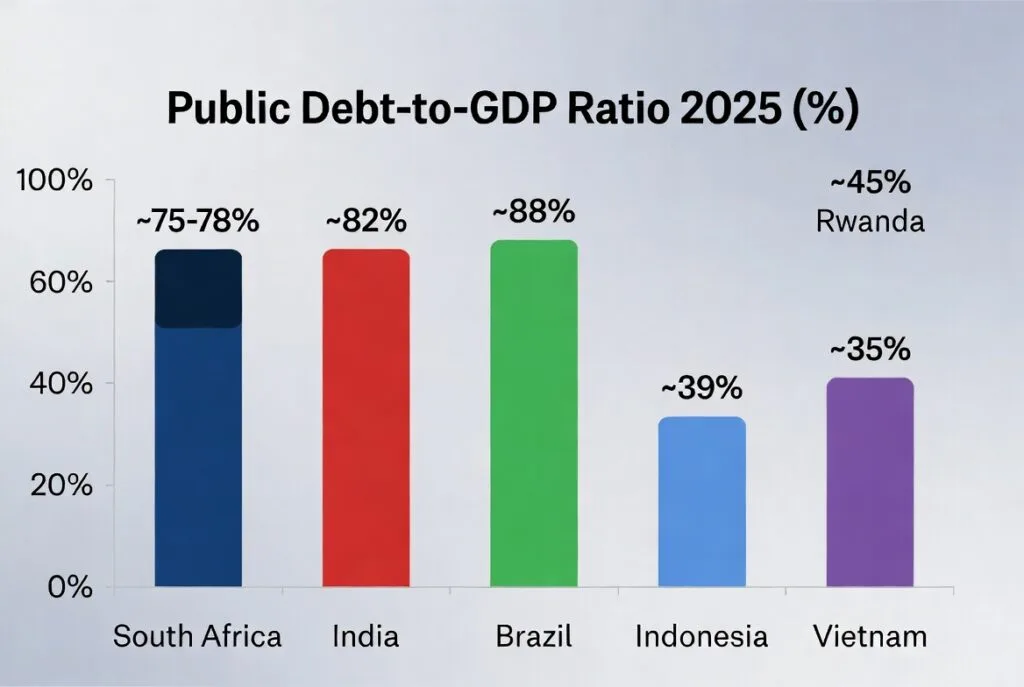
(South Africa Debt to GDP Ratio Rising sharply from ~20% in the early 2000s to over 75% by 2025/26)
The Outcomes: A Mixed-to-Poor Report Card
GDP Growth
- 1995–2007: Respectable average of ~3.6% per year.
- 2008–2025: Average fell to ~1.1–1.4% annually.
South Africa has underperformed most peer emerging markets despite high social spending.
Job Creation
Unemployment rose from ~22% in the late 1990s to 32–34% in 2025/26. Over 11 million new jobs were needed per the National Development Plan — far fewer were created. Small business support programmes have shown limited scale and impact.
Infrastructure Delivery
Many flagship projects suffered massive cost overruns and delays (Medupi and Kusile power stations are textbook examples). A large portion of budgeted infrastructure money has been lost to corruption, poor planning, and execution failures. On-time, on-budget delivery rates remain low.
Crime
Murder rates declined significantly from the mid-1990s peak until around 2011, but have risen again. South Africa still ranks among the world’s most violent countries. Billions spent on policing have not delivered proportional safety improvements.
Healthcare
Major success in the HIV/AIDS programme: life expectancy recovered from a low of ~54 years in 2005–2006 to around 66 years by 2024. However, broader public healthcare quality remains poor, with long waiting times, medicine stock shortages, equipment failures and declining outcomes in many areas.
Education: High Input, Extremely Poor Outcomes
Spending: South Africa allocates 6.0–7.0% of GDP to education — one of the highest percentages among upper-middle-income countries and higher than many developed nations. Cumulative spending over the last 30 years easily exceeds R10 trillion (inflation-adjusted)
- PIRLS (Reading): South Africa regularly ranks among the worst in the world. In the latest PIRLS, SA Grade 4 learners performed worse than many much poorer African countries.
- TIMSS (Maths & Science): Consistently near the bottom globally. South African learners perform far below the international average and even below several much lower-income countries.
Small Business Sector Growth
While the absolute size of the SME sector is larger today than in 1994, its growth and contribution to dynamic economic progress have been weak:
- High failure rates (over 60–70% of new SMEs fail within the first 5 years).
- Very low conversion from micro → small → medium enterprises.
- Limited contribution to innovation, exports, and productivity growth compared to peer emerging markets.
Graph 2: Unemployment Rate Trend (1996–2026)
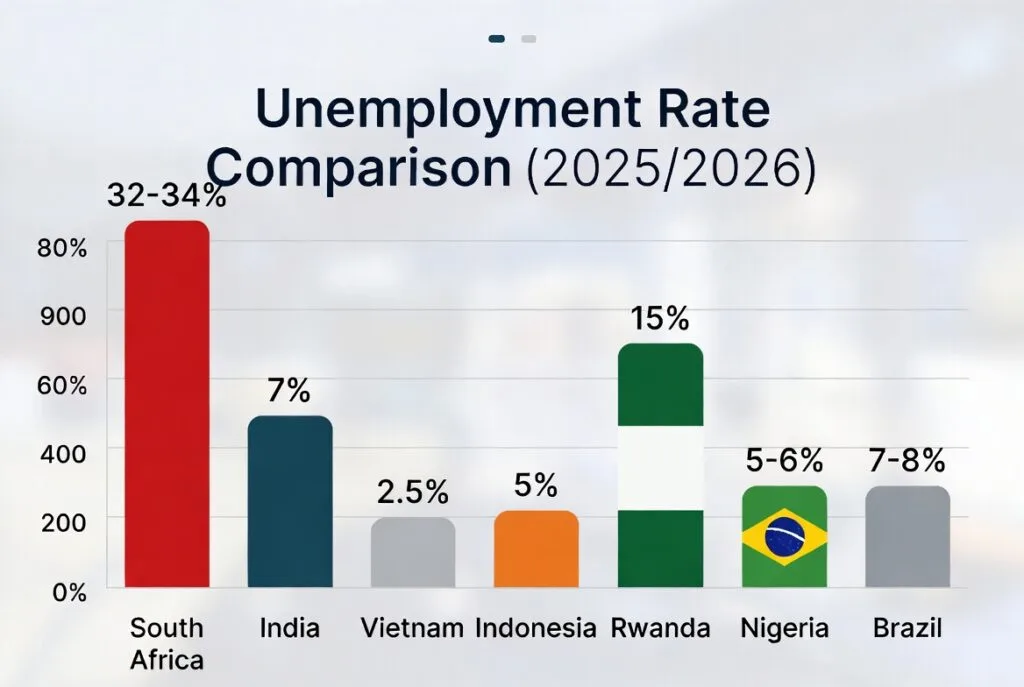
(Steady climb in South African Unemployment despite massive social spending)
National Debt: The Growing Burden
Public debt has exploded from under 25% of GDP in the early 2000s to over 75% today. Debt service costs now consume a huge portion of the budget — crowding out investment in infrastructure and social services. Much of the spending has been financed by borrowing rather than genuine economic expansion.
The Verdict: Poor Return on Capital Deployed
South Africa has one of the highest levels of redistributive spending in the world relative to its income level. Yet results in growth, employment, and service delivery have been disappointing. Key reasons include:
- Weak implementation and governance (state capture, corruption).
- Policy uncertainty and ideological rigidity.
- Poor project management and accountability.
- Rising debt service crowding out productive investment.
While there have been notable wins — particularly in HIV treatment and early post-1994 infrastructure — the overall return on trillions spent has been underwhelming. Taxpayers and businesses have received limited value relative to the capital deployed.
South Africa stands at a crossroads. With debt levels high and growth anaemic, the country can no longer afford inefficient capital allocation. A ruthless focus on outcomes, execution discipline, and evidence-based policy, rather than inputs and intentions , is urgently needed if future spending is to deliver the inclusive prosperity South Africans were promised three decades ago.